
Tim Holthaus
Sunday, April 22, 2018 | 5 minutes
Interactive Accessibility Analysis in Public Transport Using GTFS Data
Data-Driven Accessibility in Public Transport Planning
As an initial example of data-driven accessibility analysis in public transport planning, this study presents an evaluation based on timetable data. The analysis relies on data provided in the General Transit Feed Specification (GTFS) format, supplied by the Verkehrsverbund Berlin-Brandenburg under a Creative Commons V3 license.
Technical Background
Using a spatial grid with a resolution of 100 × 100 meters, travel time isochrones are computed and visualized under defined parameters, such as departure or arrival time, and maximum walking distance. The computation of a single isochrone takes approximately one second, enabling efficient and systematic comparisons between existing (as-is) and planned (target) service scenarios. This analytic approach is particularly effective for identifying accessibility deficits in current timetables and supports evidence-based strategies for developing or updating local public transport plans.
The figure below illustrates accessibility originating from Erkner, a town in the Berlin metropolitan region. The analysis assumes a maximum walking distance of one kilometer and a target departure time of 7:30 a.m. on a weekday in December 2017. All modes of public transport are included in the calculation.
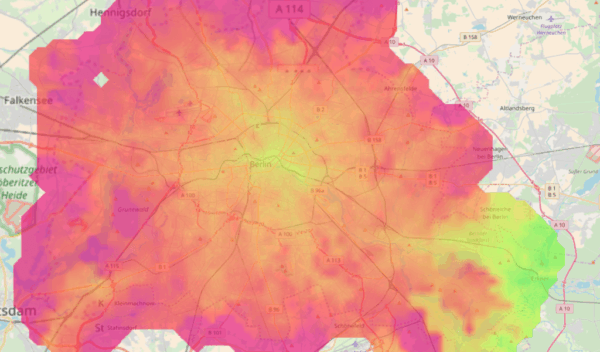
Accessibility from Erkner with a maximum walking distance of one kilometer and a departure time of 7:30 a.m. on a weekday in December 2017.
Due to the presence of the Erkner railway station, large parts of the Berlin metropolitan area are reachable within relatively short travel times. The well-developed rail infrastructure and the high service frequency of the S-Bahn network significantly contribute to the favorable accessibility conditions observed during the morning peak period.
Interactive Web Application
The video below demonstrates the functionality of the developed web-based application for interactive accessibility analysis. Users can define an origin point directly on the map interface by selecting a location of interest. Based on this input, the system dynamically computes and visualizes the corresponding travel time isochrone under predefined conditions.
The application utilizes GTFS-based timetable data and integrates user-defined parameters such as departure time, maximum walking distance, and transport modes. The near real-time computation enables intuitive exploration of spatial accessibility patterns and immediate assessment of the effects of varying input parameters.
This interactive approach facilitates a deeper understanding of public transport accessibility and supports both exploratory analysis and communication of results in transport planning contexts.
Note: The following video is hosted by a third-party provider. To protect your privacy, YouTube will not store any information about you until you click to play the video and agree to data transfer.
Influence of Departure Time on Accessibility
Accessibility in public transport systems is inherently dynamic and varies significantly throughout the day. The departure time strongly influences the spatial extent and shape of resulting isochrones. Service frequency, transfer synchronization, and the operational structure of the public transport network are key determinants of these temporal variations.
During peak hours—typically in the morning and evening—high-frequency services and coordinated transfers lead to more extensive isochrones, indicating improved connectivity and reduced generalized travel times. Conversely, in off-peak or nighttime periods, lower service frequencies and longer waiting times produce contracted isochrones, reflecting diminished accessibility. These fluctuations are particularly relevant for planning equitable transport systems, as they can disproportionately affect users with nonstandard working hours or limited mobility options.
Analyzing accessibility across multiple time intervals thus allows planners to identify temporal inequalities in service provision. This temporal perspective complements spatial analysis and provides valuable insights for optimizing timetable structures, improving multimodal coordination, and aligning mobility offerings with actual demand patterns.
The accompanying video visualizes these temporal effects by presenting comparative isochrones generated for different departure times from the same origin.
Note: The following video is hosted by a third-party provider. To protect your privacy, YouTube will not store any information about you until you click to play the video and agree to data transfer.
Accessibility Analysis in the VRS Region
Analogous to the analysis conducted for the VBB region, the following section presents travel time calculations for the area served by the Verkehrsverbund Rhein-Sieg (VRS). While the start and destination points in the VBB analysis were based on the 100 × 100 meter census grid, the present analysis employs the locations of public transport stops as both origin and destination points.
The timetable data, also provided in the General Transit Feed Specification (GTFS) format, are made available by the Verkehrsverbund Rhein-Sieg (VRS) under a Creative Commons Attribution 4.0 License.
In addition to travel times, this analysis yields further indicators such as the number of transfers required to reach a destination (see figure below). By incorporating origin–destination relationships derived, for example, from floating phone data or passenger surveys, critical connections with limited transfer buffer times can be identified. Such findings are particularly useful for assessing reliability and resilience in network design.
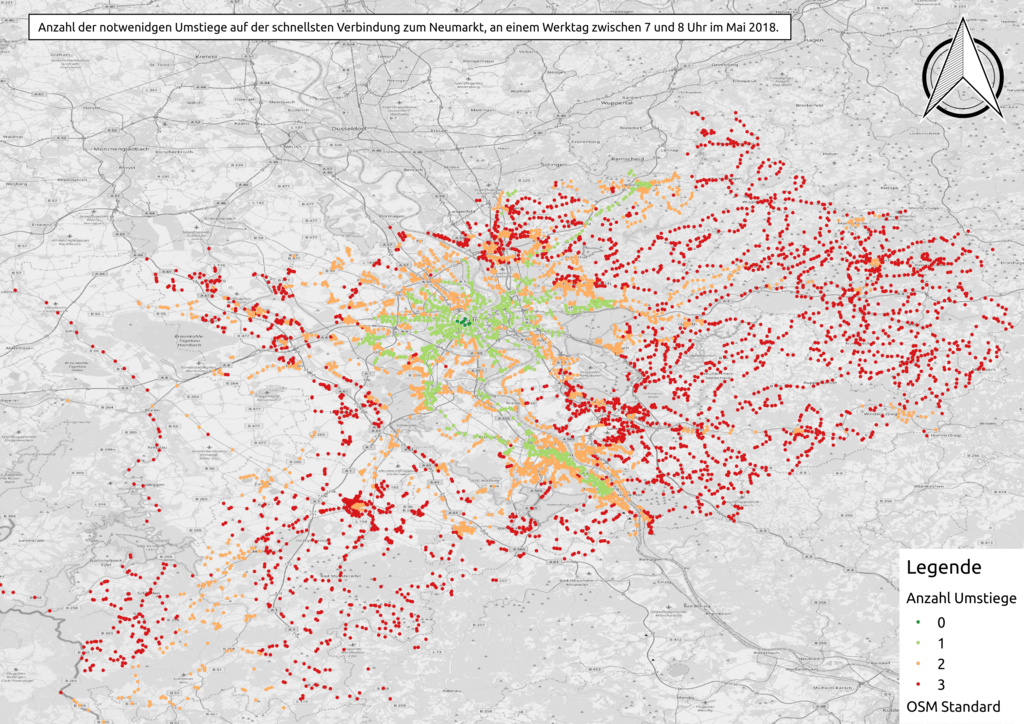
Number of required transfers on the fastest connection to Cologne Neumarkt, on weekdays between 7:00 AM and 8:00 AM, in May 2018.
Moreover, these evaluations can inform the identification of major transfer hubs, which play a central role in network efficiency. The results may also provide valuable input for the design and layout of key interchange points. Notably, the initial boarding of a public transport vehicle is treated as a transfer within this analytical framework.
The example illustrates that the stop Neumarkt in Cologne is typically accessible on weekdays with just one transfer from most parts of the city. The strong rail connections towards Bonn and Wermelskirchen are also clearly visible. Overall, an increase in the number of required transfers can be observed when traveling towards the western and eastern parts of the VRS area.
The video below demonstrates the functionality of the developed web-based application for interactive accessibility analysis for the VRS Region.
Note: The following video is hosted by a third-party provider. To protect your privacy, YouTube will not store any information about you until you click to play the video and agree to data transfer.