
Tim Holthaus
Wednesday, August 29, 2018 | 2 minutes
Comparison of Timetable Versions Using Travel Time Isochrones
Isochrones derived from real timetable data enable a direct comparison between different timetable versions. This method plays a key role in identifying deficits within transport networks and irregularities in service frequency. Beyond timetable optimization, visualizing isochrones can also serve as an effective communication tool for public information. By presenting timetable improvements in a simple and easily understandable format, these visualizations foster greater public acceptance of timetable changes.
Case Study: Wuppertal
Following the reconstruction of the Wuppertal main station and its surrounding area, the new bus terminal—located directly adjacent to the station and accessible from platform one—is expected to be completed within this year. According to timetable data recorded in the EFA system, the terminal is scheduled to open to bus traffic on Sunday, October 28, 2018.
The figure below illustrates travel time isochrones toward the main entrance of the City-Arkaden (Calvinstraße / Alte Freiheit), both before and after the terminal’s commissioning, based on an arrival at 8:00 a.m. The City-Arkaden represent the Elberfeld city center and serve as a simplified reference point for accessibility analysis.
Each isochrone delineates areas from which the city center can be reached within 20 minutes of travel time, assuming a maximum walking distance of one kilometer and selecting the route that most closely aligns with the target arrival time.
Data and Findings
The calculated isochrones are based on timetable data in GTFS format, provided by VRR AöR. The analysis reveals an improvement in north–south accessibility, indicating a positive effect of the new bus terminal. In contrast, east–west connections appear weaker, though this cannot be attributed to the timetable change itself.
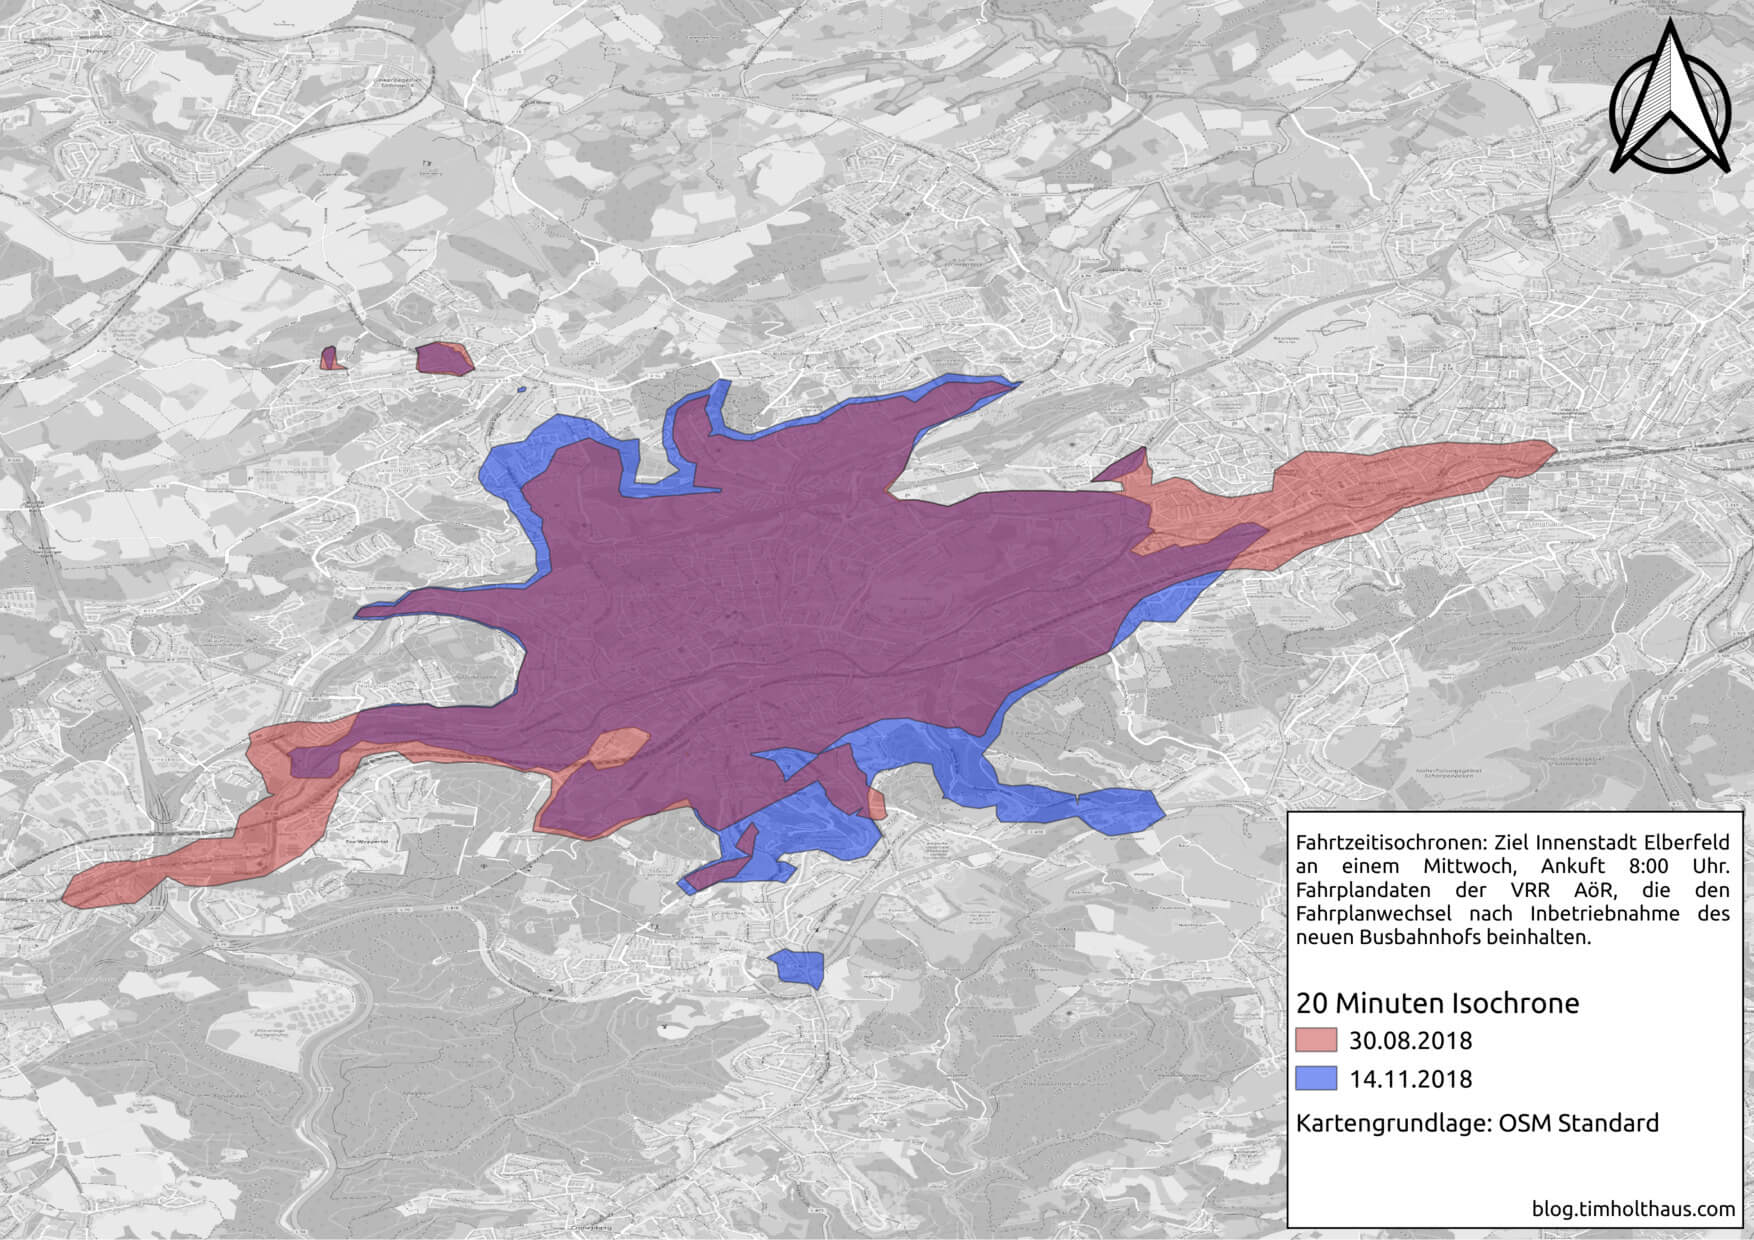
Travel time isochrones: Accessibility of the city center before and after the opening of the new bus terminal in 2018.
Limitations
A key limitation arises from the provided dataset: data for the Wuppertal Suspension Railway (Line 60) were missing as of October 27, 2018. Consequently, the algorithm used for visualization redistributed certain connections, notably to Line 611, in the absence of complete data.
Citation
If you cite this post, please use:
@online{holthaus_20180829_gtfs_compare,
  title   = {Comparison of Timetable Versions Using Travel Time Isochrones},
  author  = {Holthaus, Tim},
  year    = {2018},
  month   = {08},
  day     = {29},
  url     = {https://me.timholthaus.com/posts/stories/20180829_gtfs_compare/}
}